Measurement Data
Measurement Data
I designed a electro-mechanical platform to keep a camera level when mounted on a vehicle for my senior capstone project at UMass Lowell in 2010. For the project I created a sensor board, that included an accelerometer and gyro, as well as a control board that could record the sensor data to a SD card. The electronics were used to capture measurements of a vehicle during a field test.Powered by the car electrical system, the control and sensor boards were positioned on the passenger side floor of the car. A button was connected to the control board to toggle data collection. A FAT formatted micro-SD card was inserted to capture data to files for analysis on a computer.Illuminated LEDs indicated the control board's state. Once toggled data was recorded every 180 seconds into sequentially numbered files. The LED array showed a binary counter indicating the file number being recorded. Three axis of accelerations and two axis of angular velocities were recorded to the file every 6ms.The journey included a typical suburban trip with velocities up to 40MPH. The route was chosen to provide large angular changes while keeping the road surface relatively smooth. The trip included a loop around a local state park with some steeper inclines. During the trip 10 files were recorded to the micro-SD card.These files were examined in Excel to select a sample that included large angular changes while the car was both moving and stationary.The data proved, even though filtered, to be very noisy. The possibility exists that additional in-circuit filtration may have been necessary. MATLAB/Simulink was used to post-process the data. After some experimentation with different cut-off frequencies it was found that a 5Hz low-pass filter provided sufficiently clean data.The stationary data collected while stationary was used to calibrate the sensors.
| Data Channel | Mean Value |
|---|---|
| Accelerometer X-Axis | 1988.4 |
| Accelerometer Y-Axis | 2004.1 |
| Accelerometer Z-Axis | 2536.8 |
| Gyroscope X-Axis | 1526.5 |
| Gyroscope Y-Axis | 1483.7 |
Figure 1: Measurement values of the sensor and control board at rest. While not in motion, the accelerometer measured 1G of acceleration vectored downward. The stationary accelerometer data was used to calibrate measurement sensitivities.
In addition to the stationary mean accelerometer value, the zero value was needed. According to the ADXL335 data sheet, the typical value for the zero-level is \(1.5V\) at \(3V\) supply, however the X and Y axis are kept separate from the Z axis. Reasonable values were found to be \(1.5V\) for the X and Y axis, and \(1.5545V\) for the Z.Additionally, it was important to know the 12-bit equivalent of the zero point. The following equation was used to compute the zero point values used in the firmware.
\[ {Zero}_{xy} = \frac{\frac{1.5V\times3.3V}{3.0V}}{3.3V\times 4096}=2048.0\]
\[ {Zero}_{z} = \frac{\frac{1.5545V\times 3.3V}{3.0V}}{3.3V\times 4096}=2122.4\]
The accelerometer zero points and mean values were used to determine the amplitude of the accelerations by subtracting the zero values from the means.
\[ S=\sqrt{x^2+y^2+z^2}=1\text{G}\]
Based on the data sheet it was expected that the sensitivities of all three axis were the same.
![Figure 2: The range of motion required by the platform was determined from the accelerations. This is possible at low speed, with the effects of acceleration were assumed to be small, since the total acceleration should equal 1G toward the earth. Using the z axis and each of the other two separately the angle of the orientation of the platform was estimated using the following equations.\[\theta_x = \tan^{-1}\left(\frac{x}{z}\right)\]\[\theta_y = \tan^{-1}\left(\frac{y}{z}\right)\]The motion was limited to approximately \(\pm 15^\circ\). This is the lower bound of motion that the platform was expected to move. A safety factor was added to the measured values.](/user/pages/images/2022/05/platform_data_02.png)
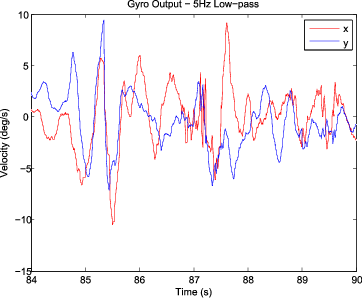
An examination of the gyroscope data was also made. The gyroscope IC was not ratio-metric. The zero values and sensitivities were taken from the gyroscope LPR510AL data sheet. The gyroscope mean values from Table 1 were used as the stationary values. With a sensitivity of \(10mV/^\circ/s\) and a 12-bit \(3.3V\) range, the sensitivity was \(12.4121 (\text{12-bit value}/^\circ/s)\). The gyroscope data is shown in Figure 4.

| Range of Motion | Rate of Motion |
|---|---|
| \(\pm 15\deg\) | \(\pm 10\deg/s\) |
Figure 4: Summary of range of motion and angular velocity the platform was expected to require.